
July 27, 2023
It’s just another late Tuesday afternoon in the lab.
After several days of planning your experiment to a tee, you’ve spent hours automating it in the lab. And now, at long last, you’ve finished the execution.
Your batteries are running low, but your anxiety levels are high. Understandably so. By this point, you’re emotionally invested. All you want to know before heading home is whether your experiment has worked.
But as all biologists know, before you can get an inkling, a means to spot a pattern that’ll give you a “yes” or “no” answer, you’ll have to spend ages structuring, then analyzing your data. And you’ll need to multiply “ages” by another age if you’re doing a Design of Experiments (DOE).
First, there's the dull, manual copying and pasting of data
Structuring your data and metadata isn’t something that gets any biologist up in the morning.
Why would it be? You don’t choose to become a biologist because you’re a meticulous copy-and-paster. You’re human, so the margin for error will be high. But you have to try your best, because it’s a critical first step toward experimental insight.
You can end up spending hours obsessively checking whether you’ve correctly aligned your DOE data with your experimental design. Maybe even days, if your DOE design is particularly complex, or if your experiment runs across multiple plates or different time points.
Only after all of this work can you reassure yourself and check whether your experiment has worked by plotting the raw data. But at this point, there’s no way for you to quickly visualize it before investing time in doing the full-on analysis.
Then comes the complex analysis with DOE software
So, you move on blindly from mind-numbing to mind-boggling work, as you start your response analysis with DOE software.
The beauty with a lot of DOE software is the limitless capability. You can do pretty much anything with it. For a statistical whizz, it’s paradise.
But if you’re just getting started with DOE, it can be overwhelming.
Most software won’t intuitively guide you through the process of checking the quality of your data, finding the factors that matter, then building a model to help you predict a response.
You’re left to figure it all out on your own. Which can make understanding whether your experiment has worked or not—and what to do next—seem even further out of reach.
All this added effort and complexity leads to more anxiety. More self-doubt and uncertainty. And a great big gap in time between 1 DOE run and the next.
DOE without the guesswork: Synthace automatically structures and visualizes your data for you
Our lab team has experienced the mental toll that structuring and analyzing experimental data can take on you. And we’ve all got the worry lines to prove it.
That’s why we wanted to create a new kind of DOE software—something that would help biologists like you sleep easier at night after finishing an experimental run. Something that would relieve you of the manual process of data structuring. And something that would give you a rough idea of how your experiment has gone at the end of a long, hard day in the lab. Then, when you’re ready to do the proper analysis, guide you through what you have to do, step by step.
Our vision came to life with the latest edition of Synthace DOE—our platform that houses the entire DOE process under 1 roof.
How Synthace makes this all possible: Your most important questions, answered
If we were in your shoes, we’d be brimming with questions. So we’ve started by answering the most important ones.
How does Synthace capture my experimental data from the lab?
For analytical devices that we can support (like Tecan’s M200, BMG’s Clariostar or the Biotek plate readers), Synthace can automatically capture experimental data. Otherwise, you can upload the data directly into Synthace.
Data is automatically linked and structured to your DOE design, even if it’s across multiple plates or executions.
What happens after Synthace structures my experimental data?
You can start analyzing your DOE data and get an immediate visualization within minutes. You can also select a subset of data and transform it.
How does Synthace store my experimental data?
With Synthace, everything is stored in the cloud, which helps you share your data and analysis with others.
How can I analyze my DOE data on Synthace?
With Synthace, you can:
- Quickly plot raw data as a function of the factor tested
- Select a subset of data and remove outliers
- Apply transformations (log, box-cox, or you can write your own python expression, among others)
- Model 1 or multiple responses
- Manually select and model significant effects, or allow Synthace to automatically select them for you
- Create, explore, and compare multiple models
- Save and lock multiple versions of your DOE analysis
What happens when I want to proceed to custom analysis?
If you want to do a deeper dive outside of Synthace, simply download your structured design and results, along with the metadata, from Synthace. Then, you can upload everything to your tool of choice.
Synthace DOE's data structuring and visualization in action
Skeptical whether it all could be that simple? It’s easier to believe it once you’ve seen Synthace in action.
Data structuring
Imagine you've completed an experimental run. Synthace would guide you to access the structured data by clicking "Structure Data on the Map".
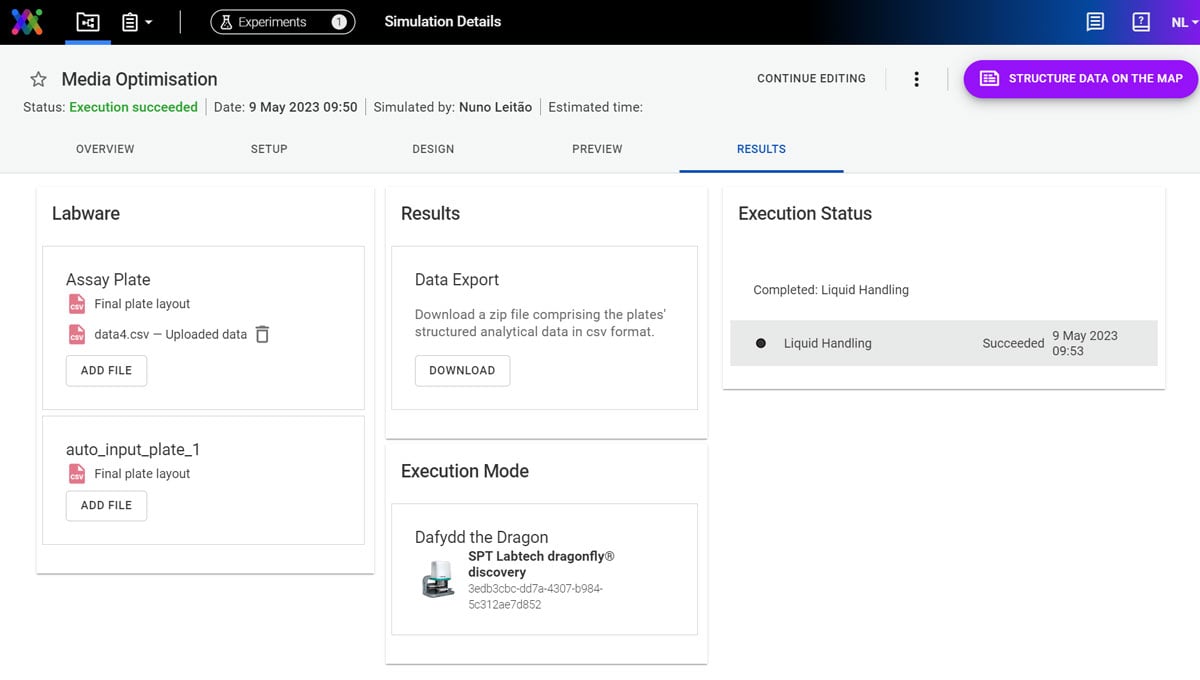
There, you can preview and download the tabular data, select which columns to include: different responses, design factors or execution factors.
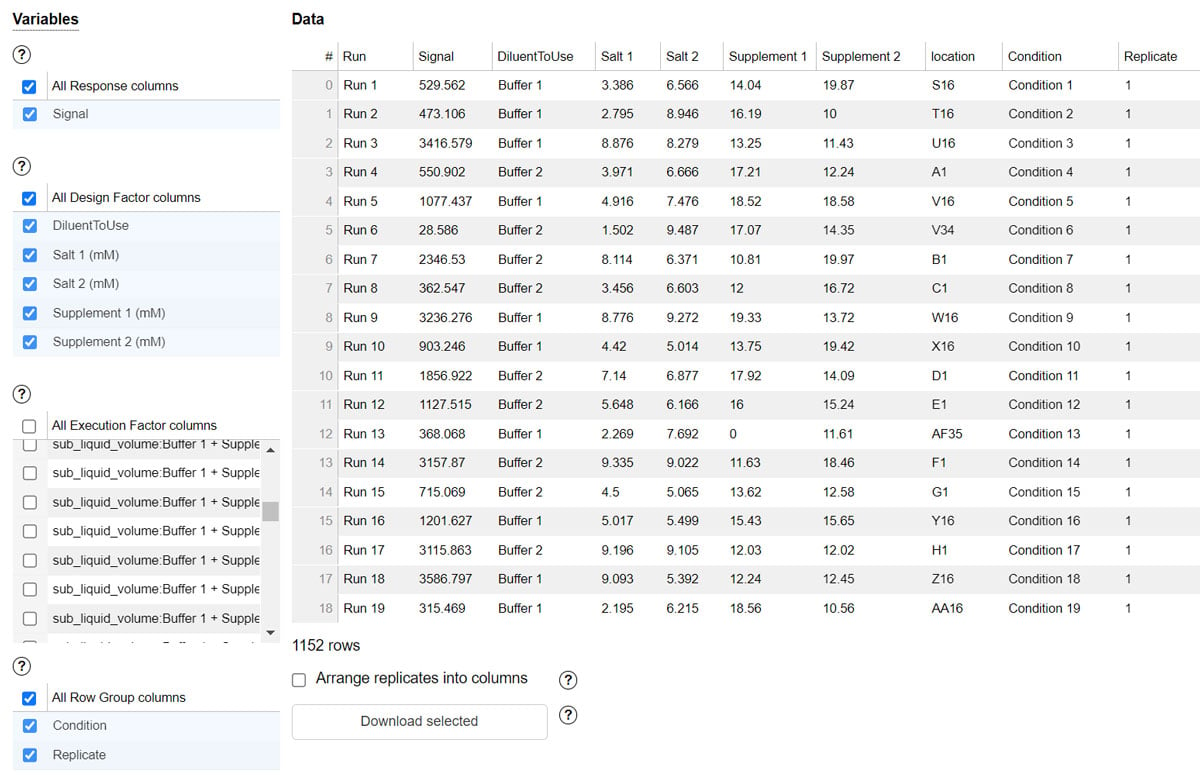
At this point, you can also instantly get an idea of how your experiment went by visualizing your raw DOE data.
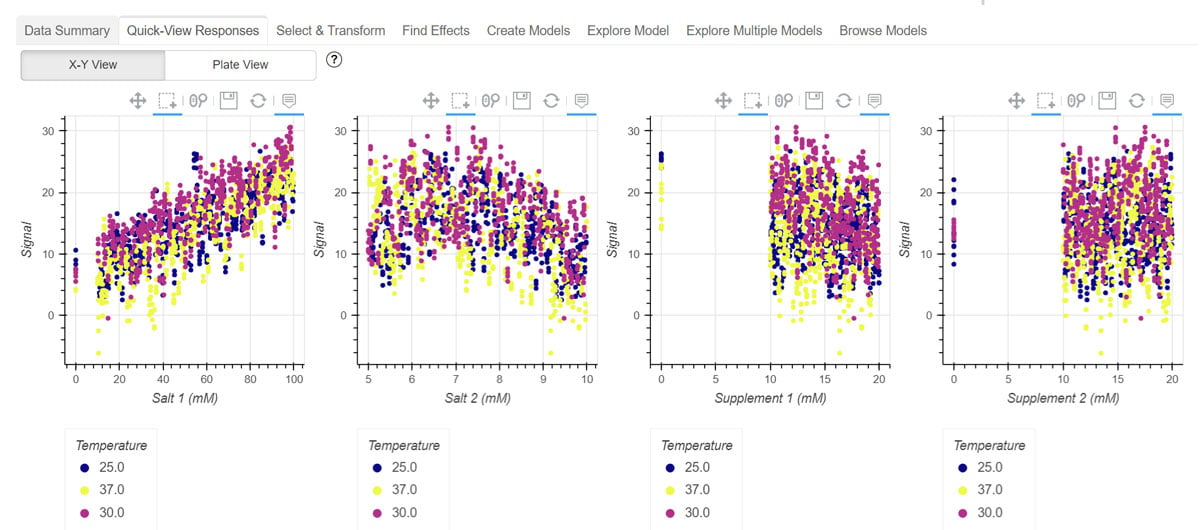
Data visualization
You can also drill down by selecting a subset of your data, transforming and evaluating it.
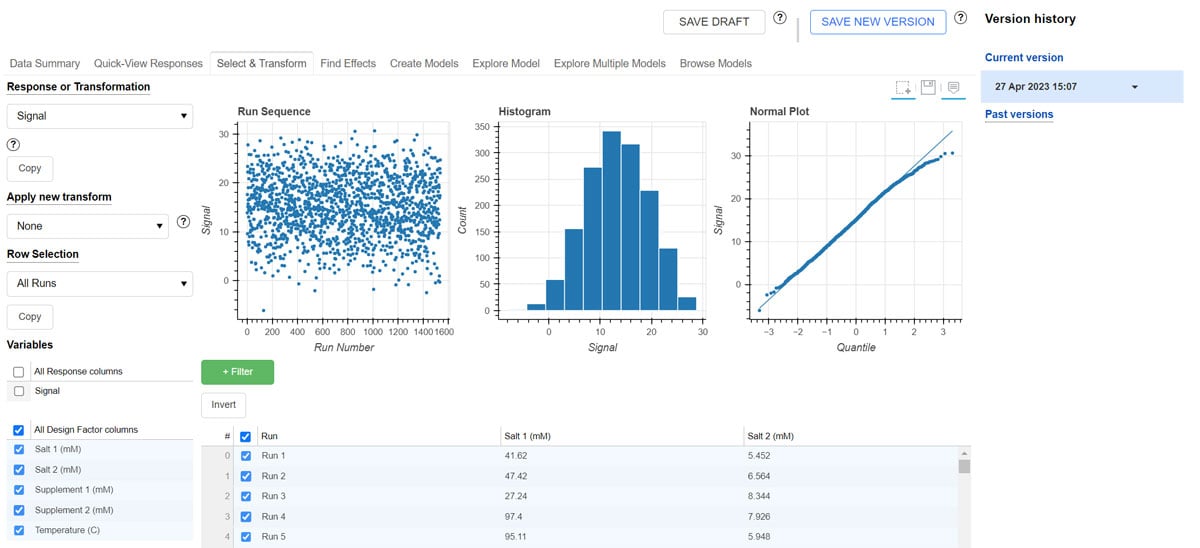
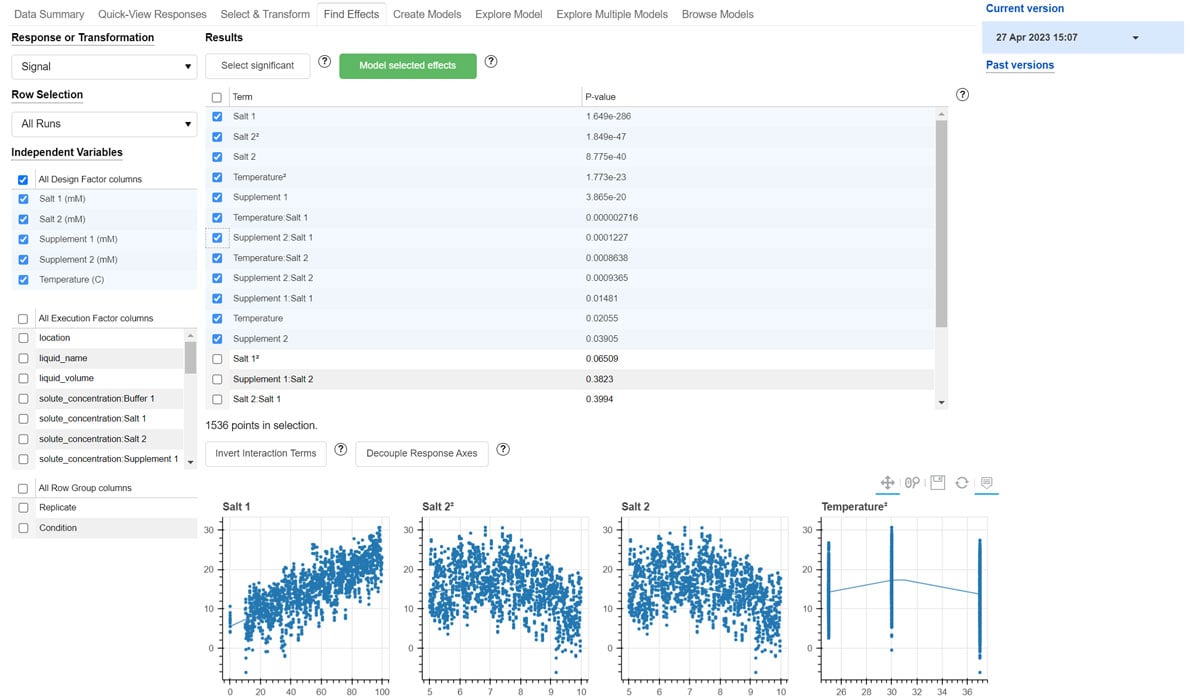
You can choose to select which effects should be modeled, and preview how they describe the data. Or you can let Synthace select the effects for you.
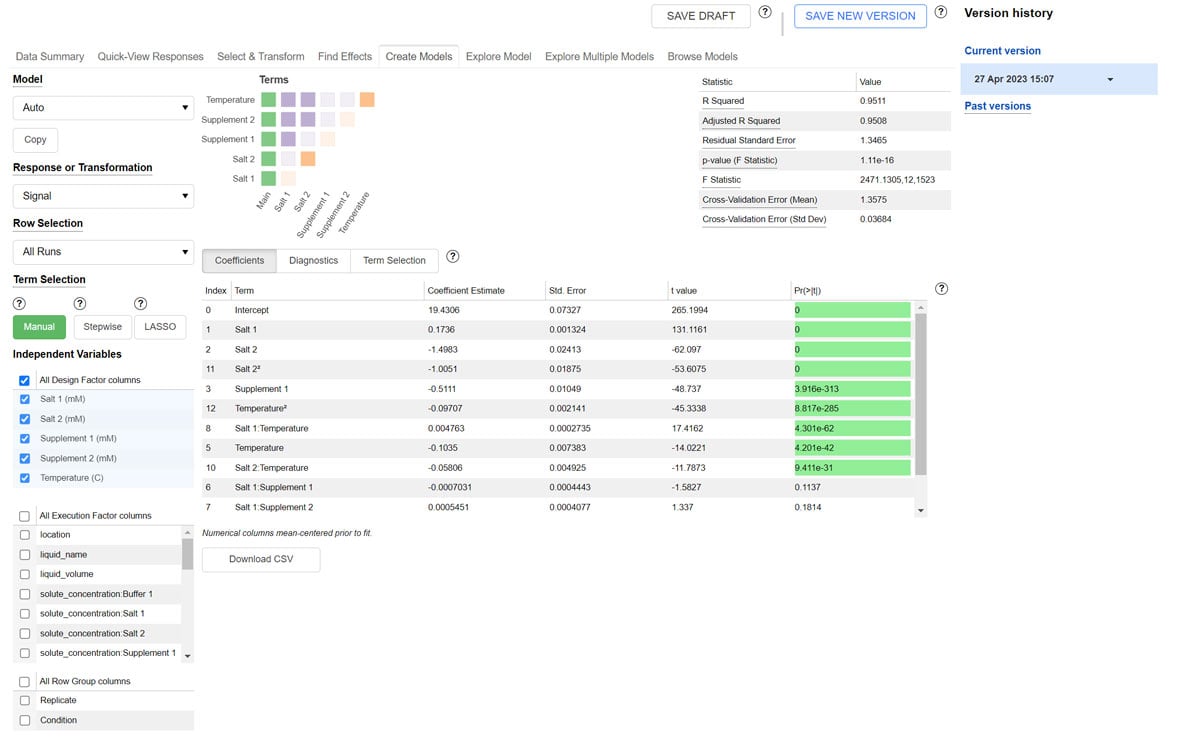
Synthace allows you to try out different models to see which one fits your data best.
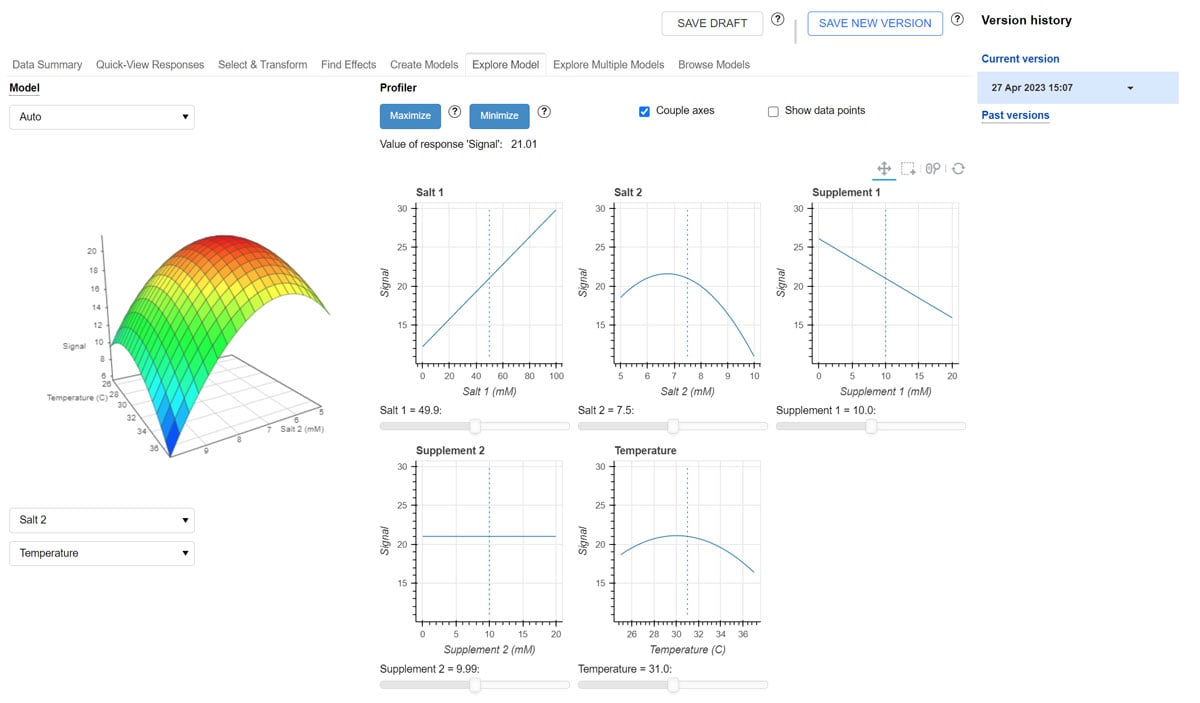
Finally, you can explore a model in depth and find the optimal run conditions.
Perhaps now you’re ready to run your process at scale, as you’ve found your optimal run conditions. Or maybe this was just part of a larger DOE campaign, and you’re now ready to design the next round of DOE.
Whichever path you take, you can be confident that your analysis is sound, and you can always come back to it, or share it with others.
Want to learn more about Synthace DOE?
Try taking an interactive product tour. And to see how Synthace's DOE workflow could cut time to insight in your lab, our team are here to help—arrange a demo today.
Tag(s):
Design of Experiments (DOE)
Other posts you might be interested in
View All Posts
A Synthesis interview
Meet Professor Chris Molloy, CEO at Medicines Discovery Catapult

6 min
A Synthesis interview
Meet Thierry Dorval, Head of Data Science and Management at Servier

7 min
A Synthesis interview
Meet Dan Thomas, CEO & Founding Consultant at Twenty24 Consulting
15 min