
October 13, 2022
Experimental campaigns typically comprise many experiments and each one might include multiple individual physical executions.
Keeping track of multiple executions and how they relate to each other in the context of an experimental campaign is hard. There are various aspects to each experiment that need to be recorded and appropriately organized–not only for posterity but to facilitate the drawing of valid conclusions.
- Planning documentation, physical execution plans, and how they combine to produce our datasets and data analyses are pieces that are not inherently linked and are often spread across multiple records (like different software or offline information).
- When it comes to data analysis, experiments can yield differently structured datasets that need to be aligned, analyzed, and visualized altogether - a process that also needs to be documented.
- You may want to enrich your datasets with relevant experimental metadata for added insight during analysis. But capturing and aligning such metadata can be very cumbersome.
In short, following and appropriately documenting even a single experiment from start to finish is a burdensome process. Extend that to a complex campaign, and things start getting out of control.
Various software solutions, such as ELNs, can help–to a certain degree bring these different sources of information together under a single “Experimental Campaign”, but it still leaves a lot of the work down to us scientists to make the connections between these bits of information explicit. This creates additional overhead.
The Synthace platform helps to overcome this burden by automatically tracking any information about both the planning and execution of experiments.
Let’s take a look at it in practice.
Connecting the dots - automatically
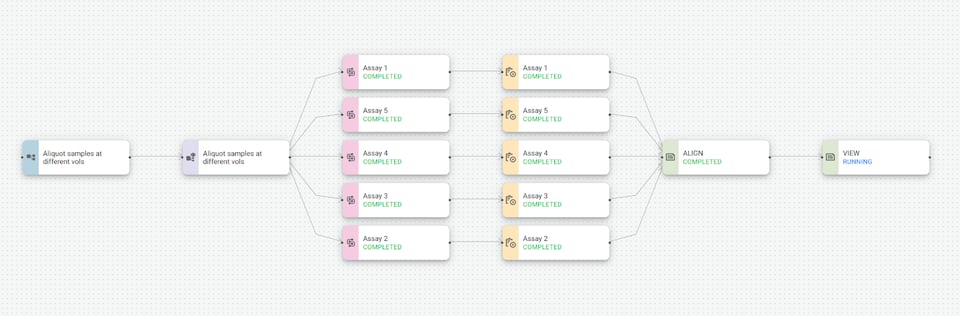
Entities in Synthace–such as workflows, simulations, and executions–can be added to an Experiment so they can be easily located. Whereas the Experiment Report shows these as a list, the new Experiment Map reveals the relationships between the entities.
This view automatically shows you any existing additional linked entities to the ones that you have previously added, so you can follow the progression of the experiment over time.
What this means:
- You can group distinct experimental steps in one place and then see how the experiment develops as any linked entities are automatically displayed
- You merely need to provide Synthace with the starting point of your experiment by adding the relevant entities to an Experiment. The progress will be automatically tracked
Align and combine data outputs
Attempting to align data from multiple executions across multiple experiments can pull you into a dangerous rabbit hole. Since they are often not structured in the same way, combining them is a painstaking process.
Synthace can now seamlessly align and append data from different data sources and executions, regardless of whether they were executed manually or with the help of automation. You can view or download your data in a structured format as a CSV file, including all Synthace-captured experimental metadata.
What this means:
- You can align data from multiple independently performed experiments and include experimental execution metadata with no extra effort
- You can download structured data files as a CSV from an arbitrary number of executions for use in third-party analysis software packages
Visualize your data
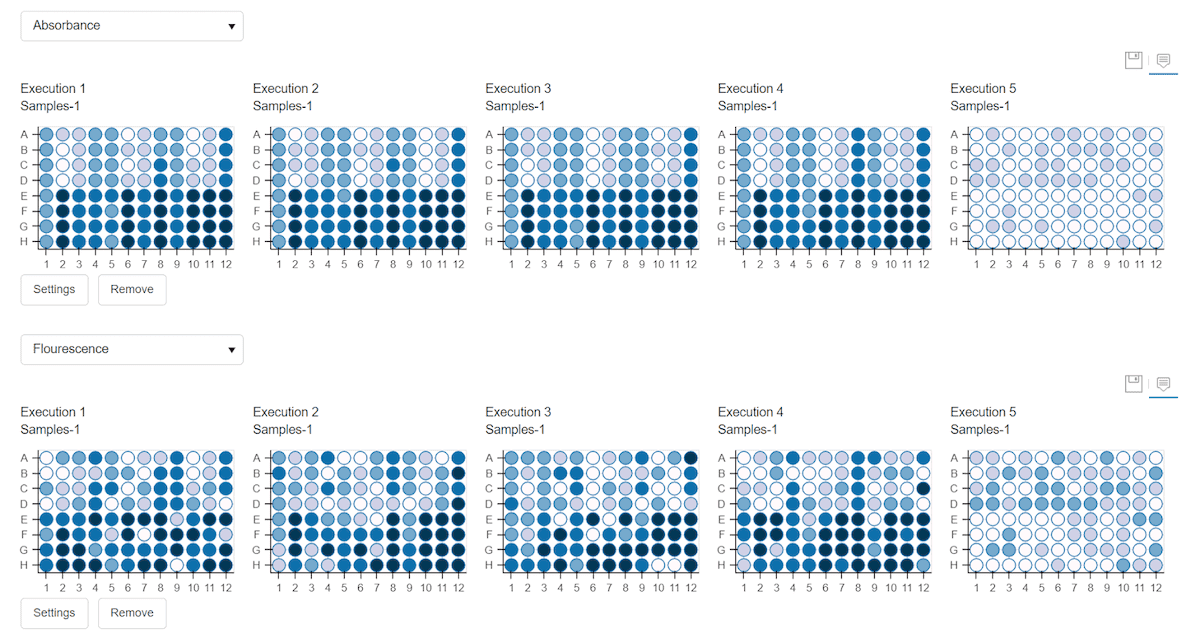
Though you can always do a deep dive analysis of your Synthace-aligned data in the data analysis software of your choice, Synthace also provides simple data visualization tools to get you started. You can generate configurable scatterplots or plate-based heatmaps from your aligned data in a single view so you can explore your data immediately.
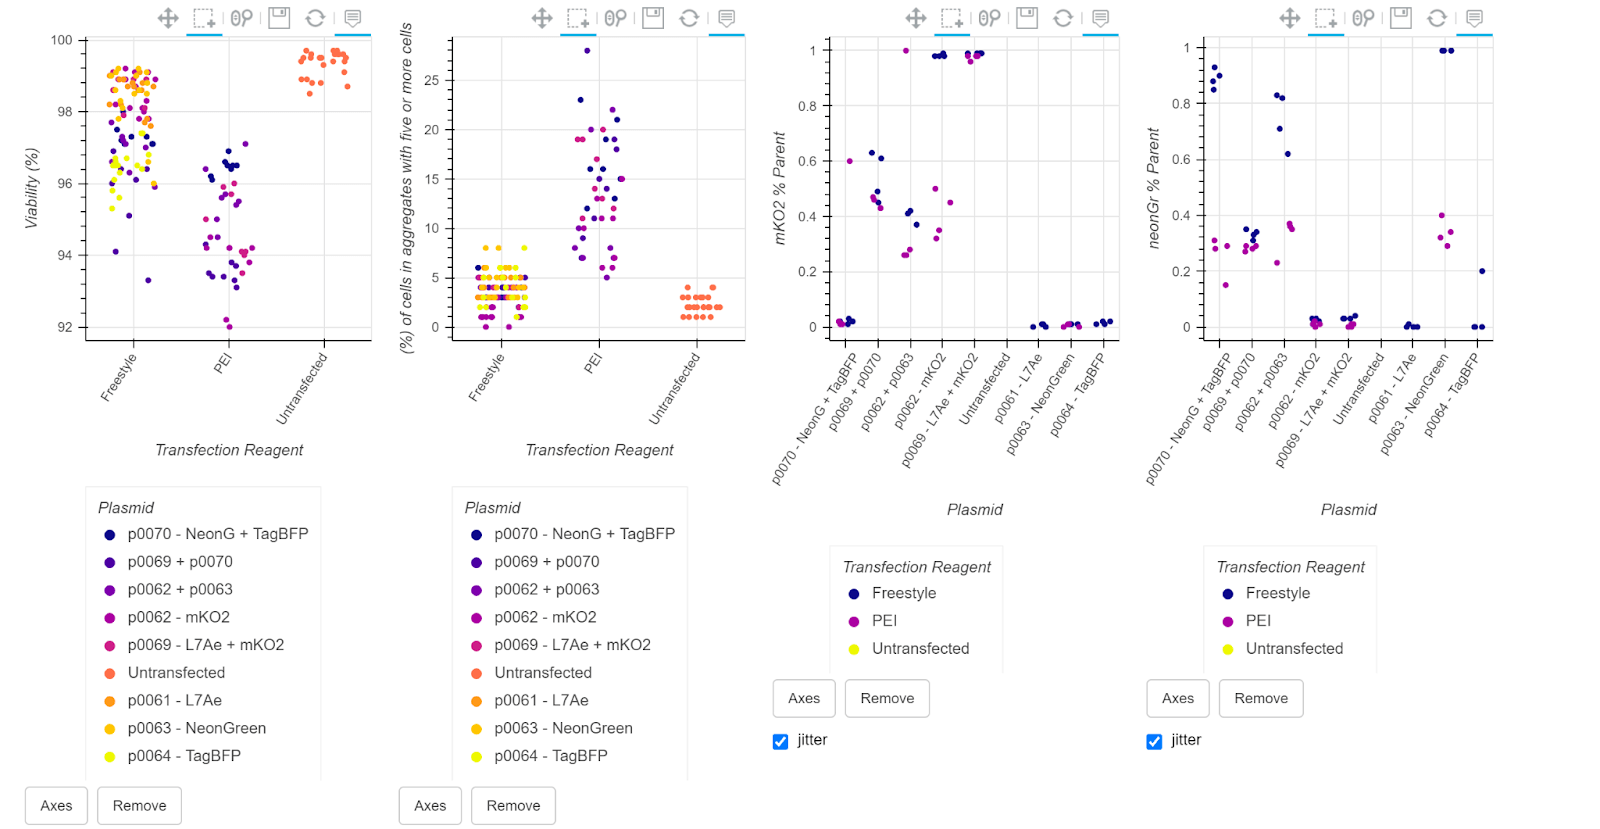
What this means:
- To speed up your time to insight, you can easily visualize your structured data from one or more independently performed experiments as configurable scatterplots or plate-based heatmaps
Understand experimental patterns - visualize execution factors
Let’s say you are running the same experimental protocol or workflow routinely and you would like to see whether there are fluctuations in your assay over time.
With the Experiment Map, you can group the different executions, align all the data into a single structured dataset and visualize the data based on an execution factor. All so you can quickly identify any problematic executions.
What this means:
- You get access to data insights across many experimental executions which were previously not available to you
- You can understand the specific outcomes of experiments–and see what is affecting your results–more quickly
Documentation of process
The Experiment Report view lets you add additional context to the broader experimental campaign, so you can easily find everything you need in one place.
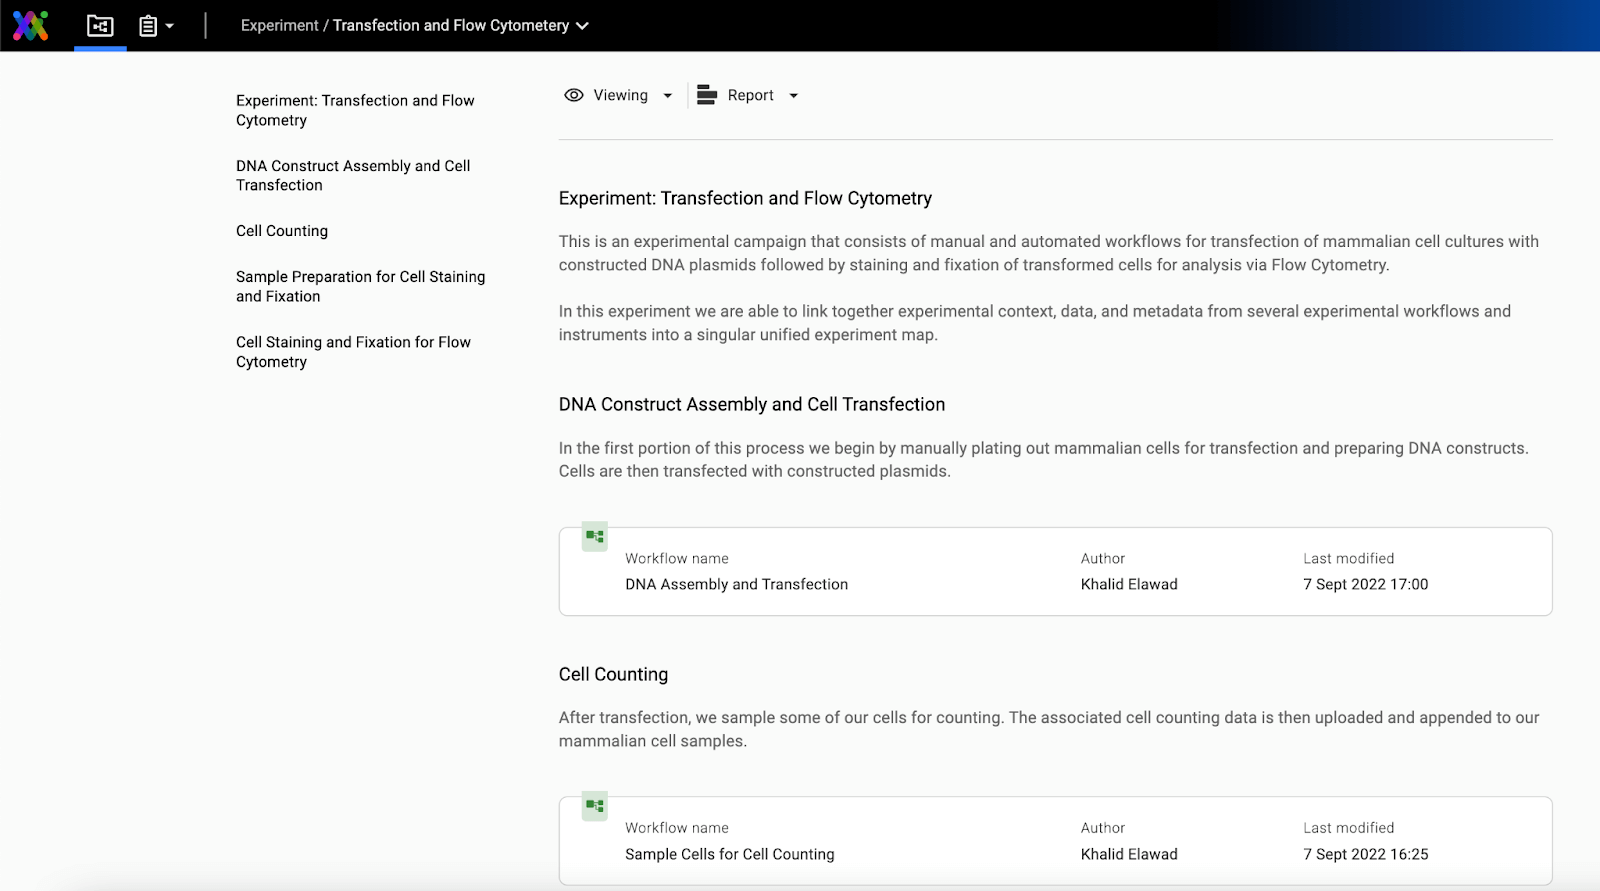
You can note down any observations, errors encountered, or protocol deviations, to make sure you know exactly what’s worked–and what hasn’t.
What this means:
- You can save time in preparing documentation by using Synthace as your focal point for gathering all your different sources of information, findings, or thoughts relevant to the experiment.
- Leave unambiguous documentation of your entire process for others in the campaign
Could this help you in your lab?
We’ve already rolled this feature out to our current customers. If you think you might want to join them, or maybe just take a closer look at what the platform can do, book a call with one of our experts—they’ll be happy to help answer your questions.
This post is part of a bigger series about our latest features. Want to read more? Links are below:
Four more ways Synthace makes your experiments more likely to succeed
Manual pipetting just got a lot easier
How to capture intent and context in your experiments
How to stay in control of your experimental campaign
Other posts you might be interested in
View All Posts
Design of Experiments (DOE)
Why Quality by Design (QbD) is vital for pharmaceutical R&D

9 min
A Synthesis interview
Meet Professor Chris Molloy, CEO at Medicines Discovery Catapult

6 min
A Synthesis interview
Meet Thierry Dorval, Head of Data Science and Management at Servier

7 min