
High Throughput Purification
Radically faster purification
Radically faster purification
process development.
Get more reliable insights from automated, high throughput purification experiments 7x faster with Synthace—by simplifying protocols on the Tecan Fluent and Evo.
Request a Demo Take a tour

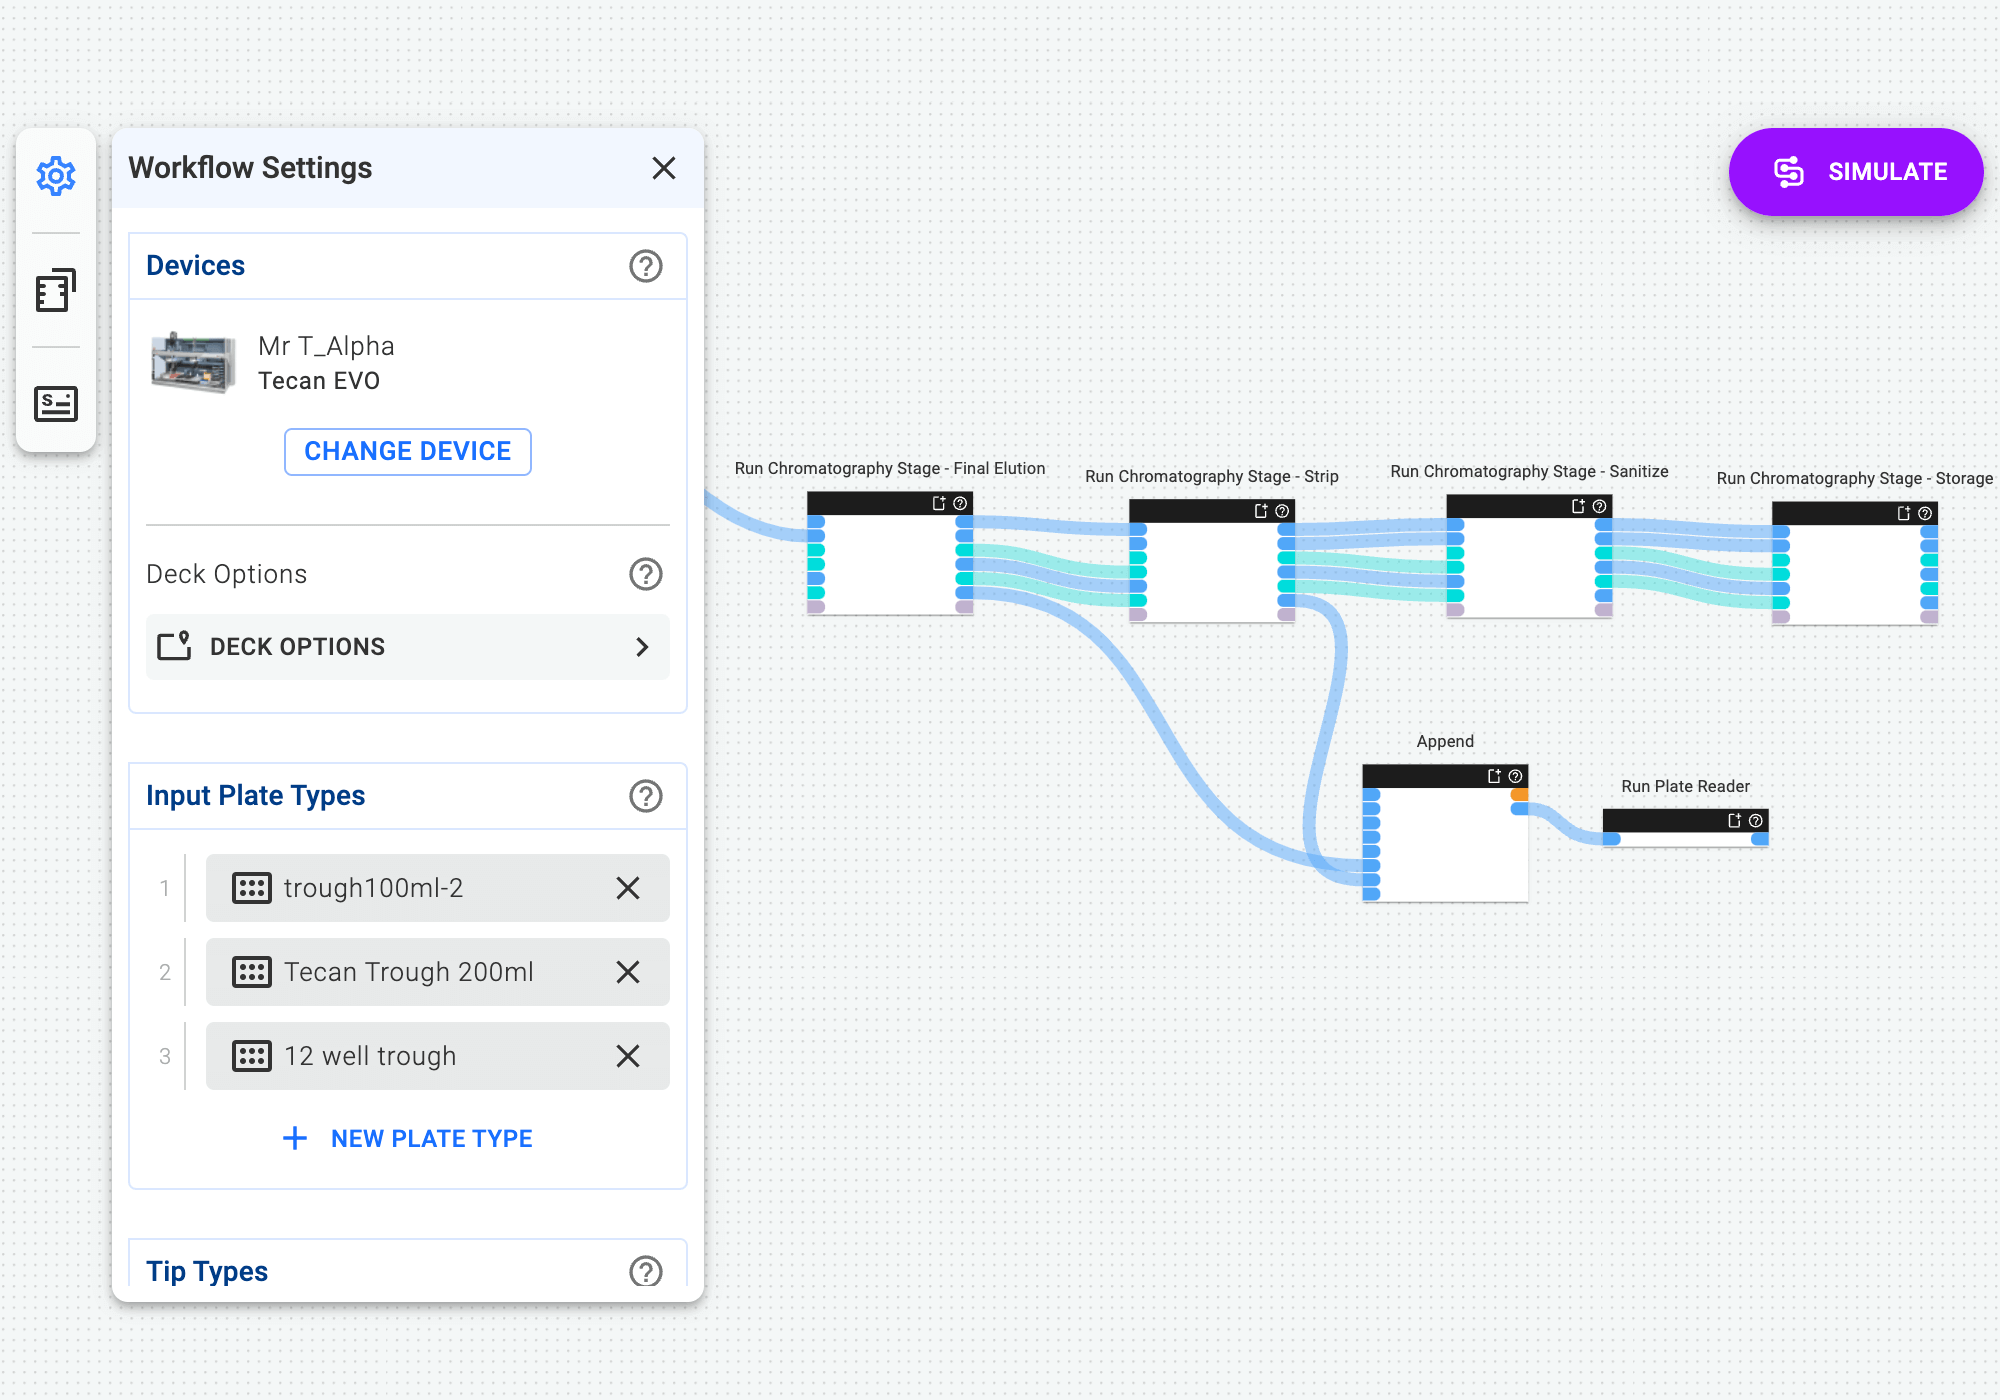
FOOLPROOF PLANNING & SIMULATION
Smarter and faster than spreadsheets.
Free up time and headspace by describing your experiment with our drag-and-drop workflow, and simulating it to check it will run as planned. Synthace keeps track of the planning and calculations for you.
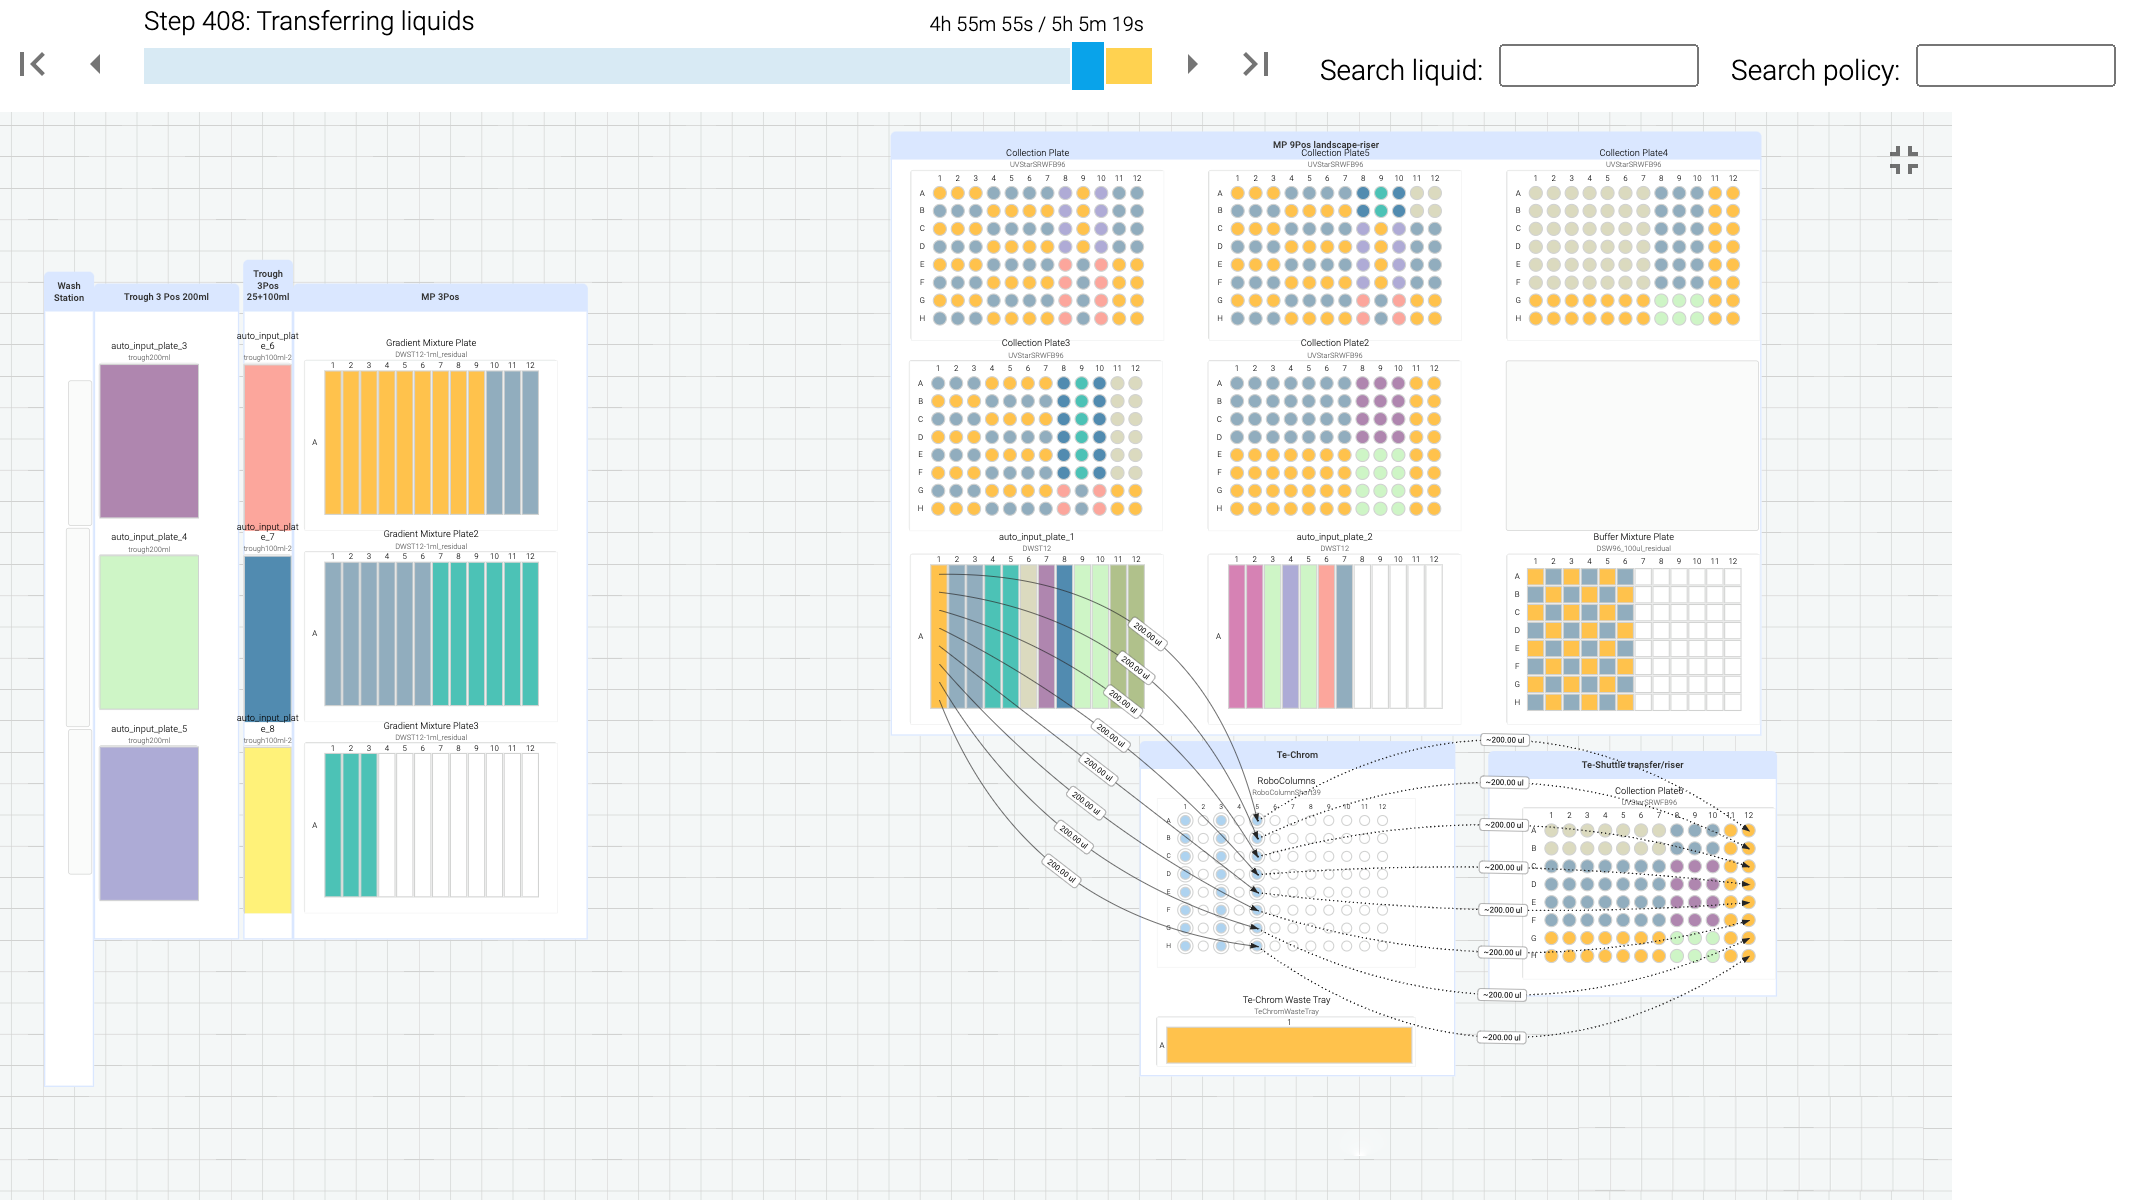
FLEXIBLE LAB AUTOMATION
Experiment execution, your way.
Skip the months of device-programming training and pains of rigid scripting. Run your ideal plate- and column-based chromatography experiments with click-to-run automation.
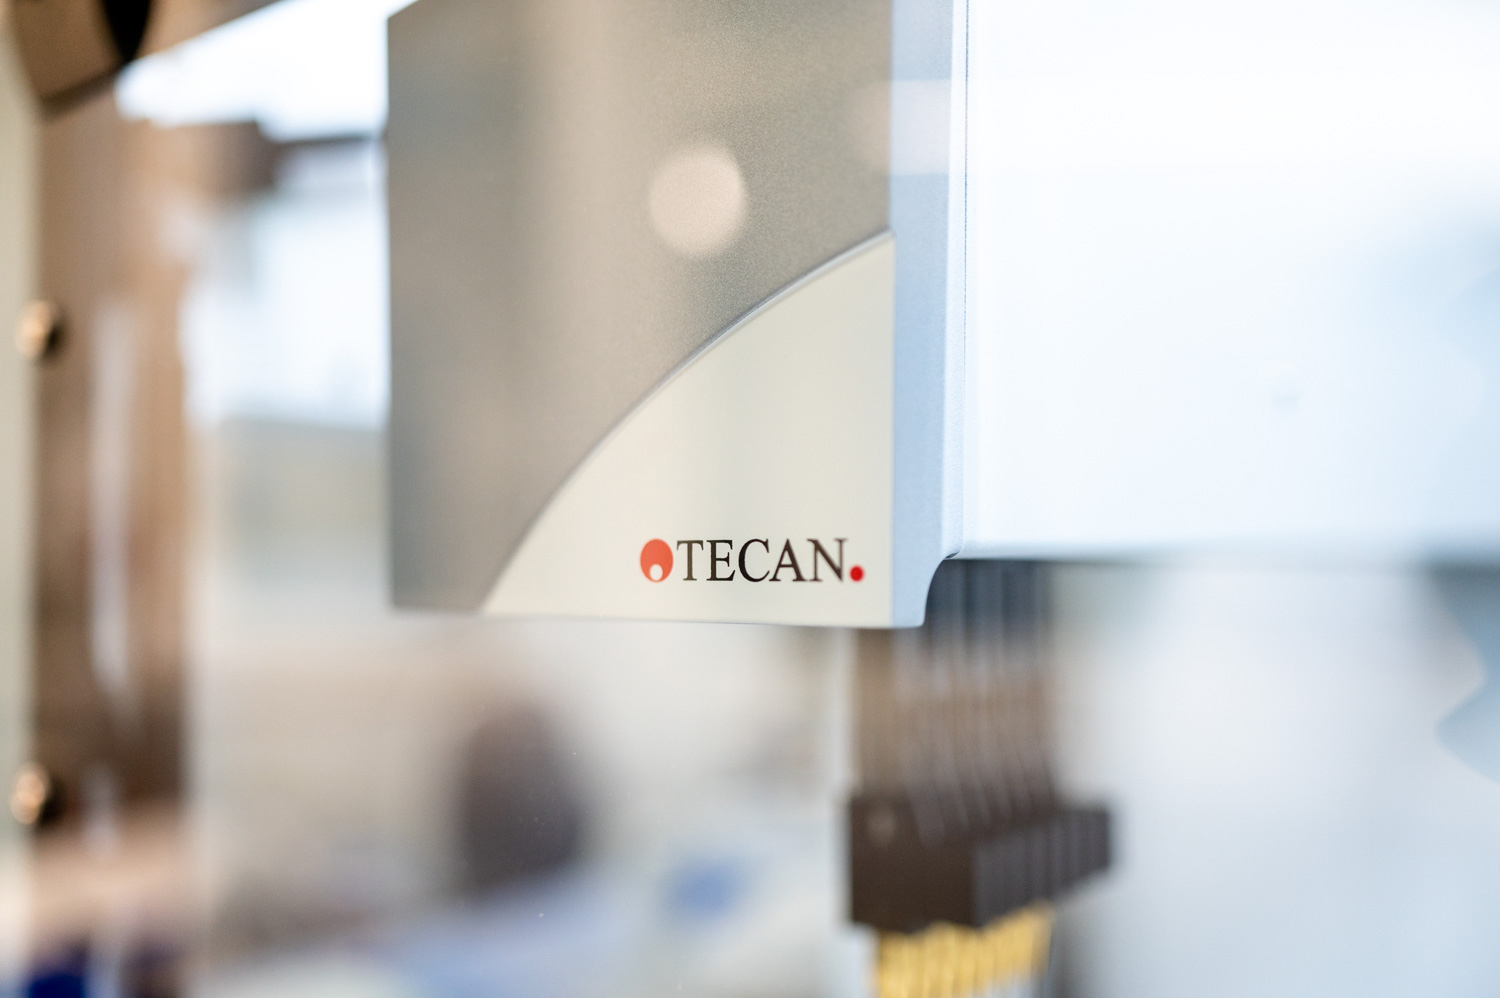
AUTOMATE YOUR TECAN
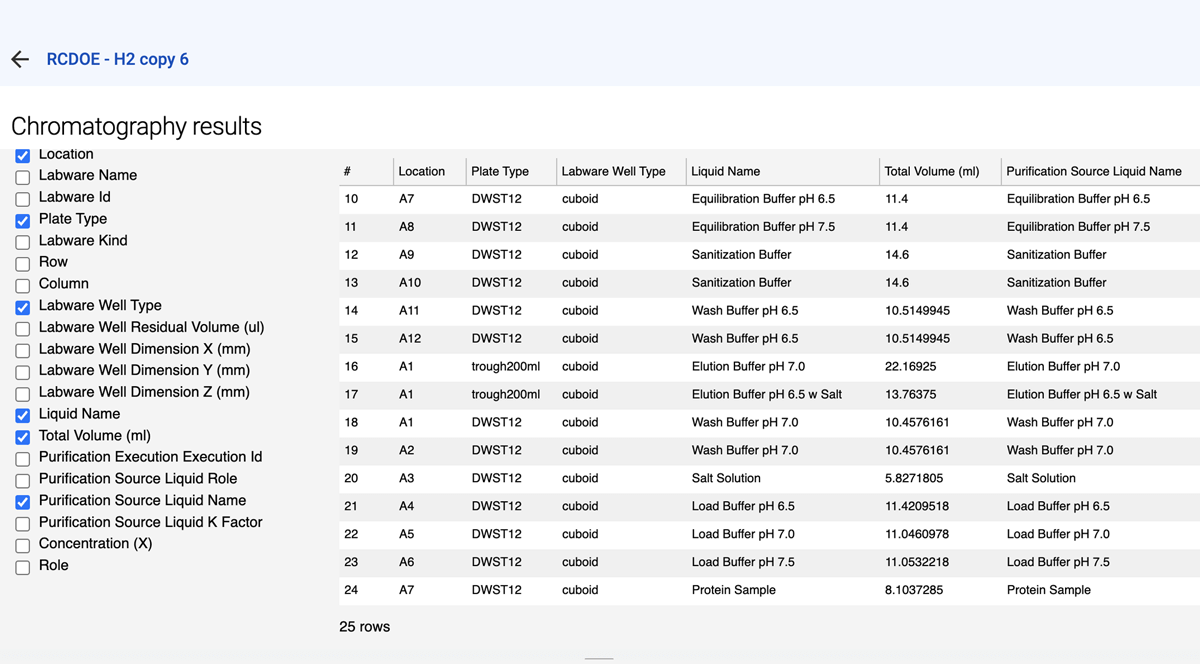
Instant, zero-code automation instructions.
Generate automation instructions for your chromatography experiments on the Tecan Fluent and Evo based on your experiment description. No more programming bottlenecks. Click “Run,” and watch your experiment come to life.
REPRODUCIBLE METHODS
Easy, consistent method transfer.
Only create your method once. Then, increase throughput and validate your findings with confidence. Run the same method on any instrument, in any location.
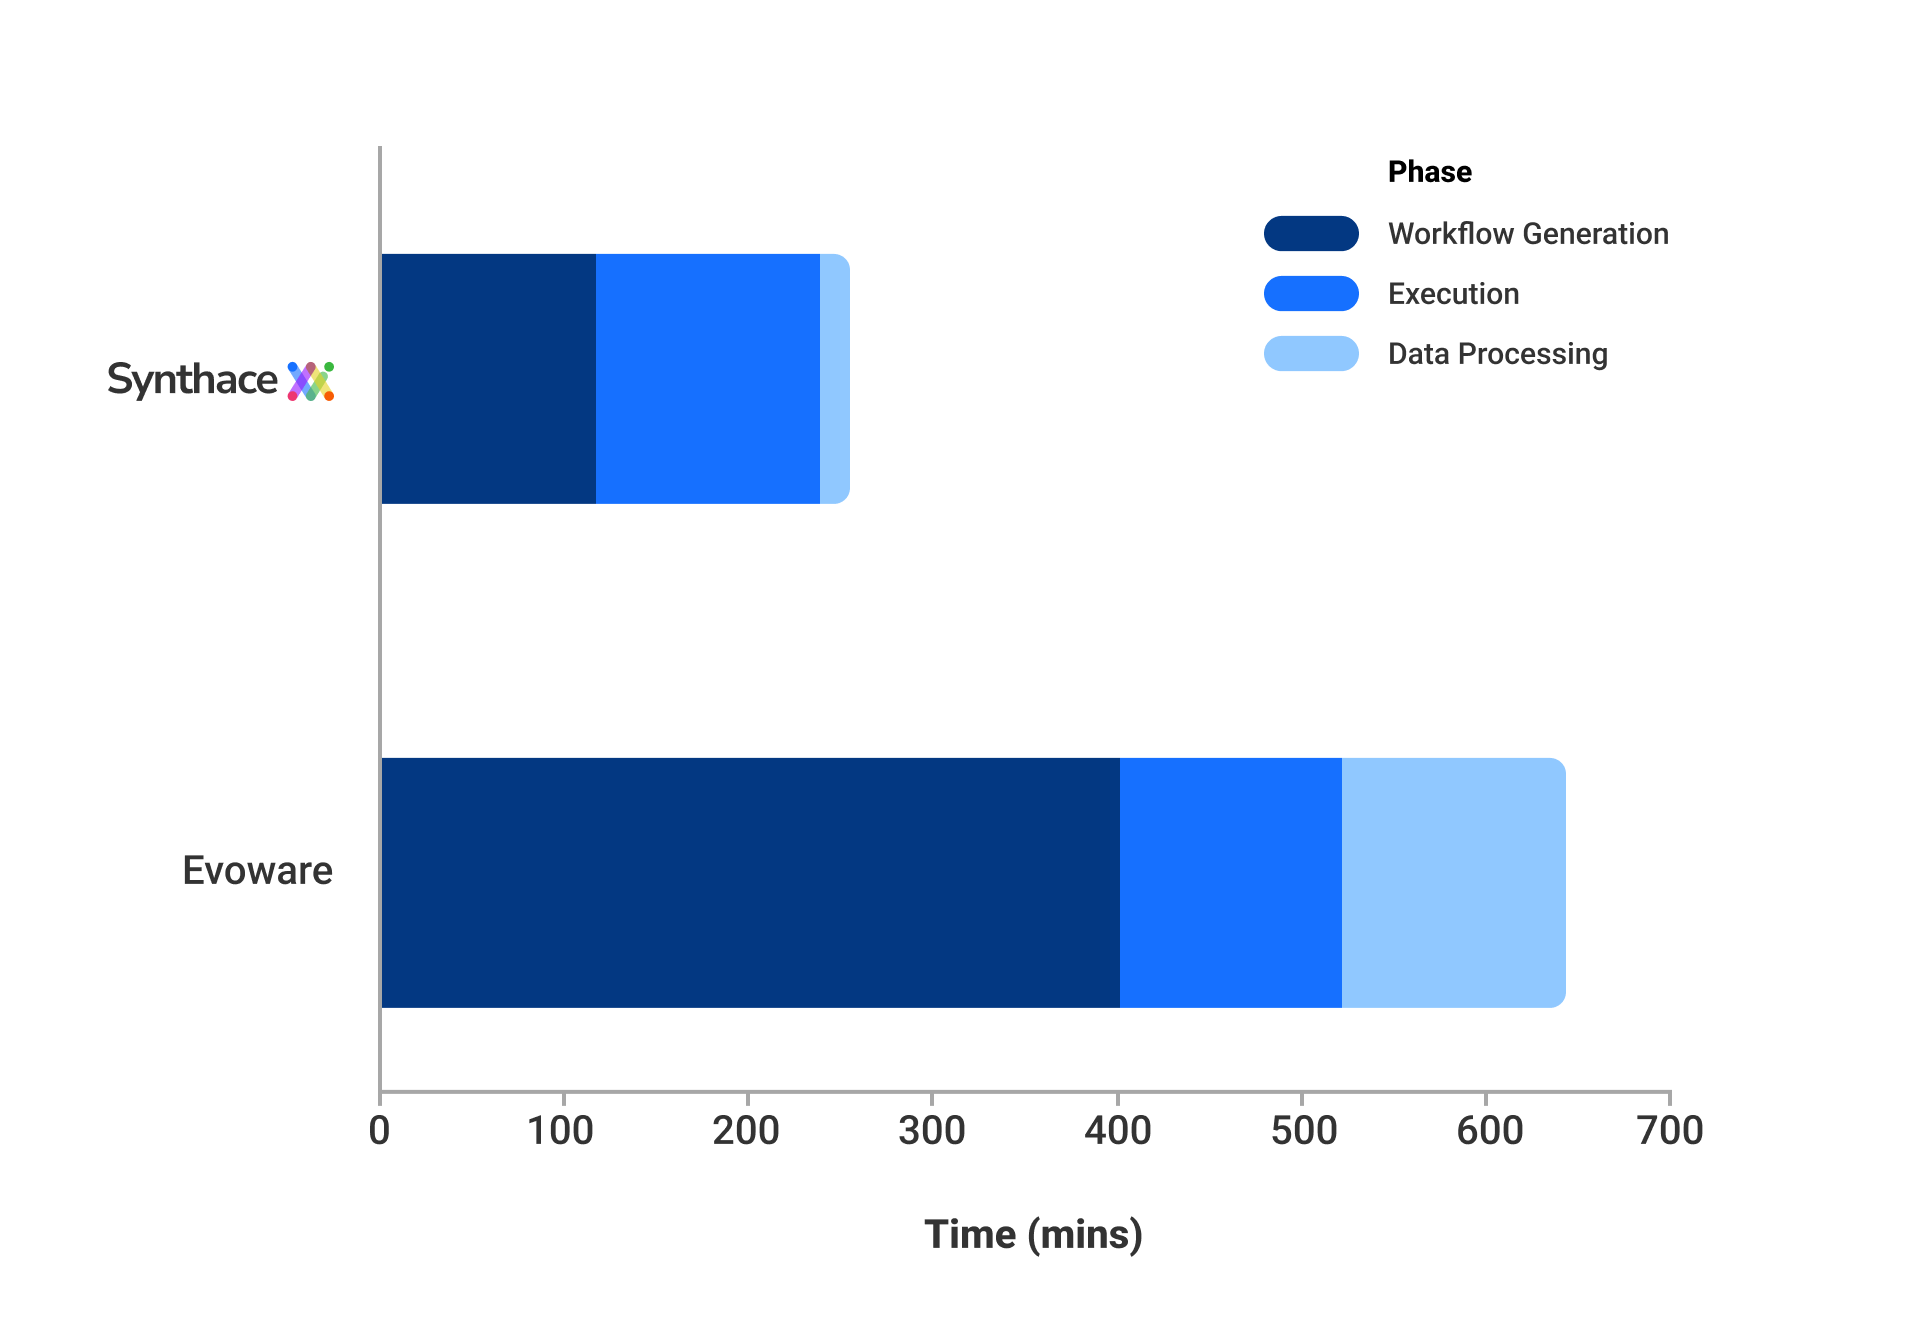
Proven time savings
CSL spent 60% less time on end-to-end micro-scale purification workflows.
"Synthace is a game-changer for useability. It allows the creation of complex workflows that I normally wouldn't have explored.”
CSL Purification Team
Parkville, Australia


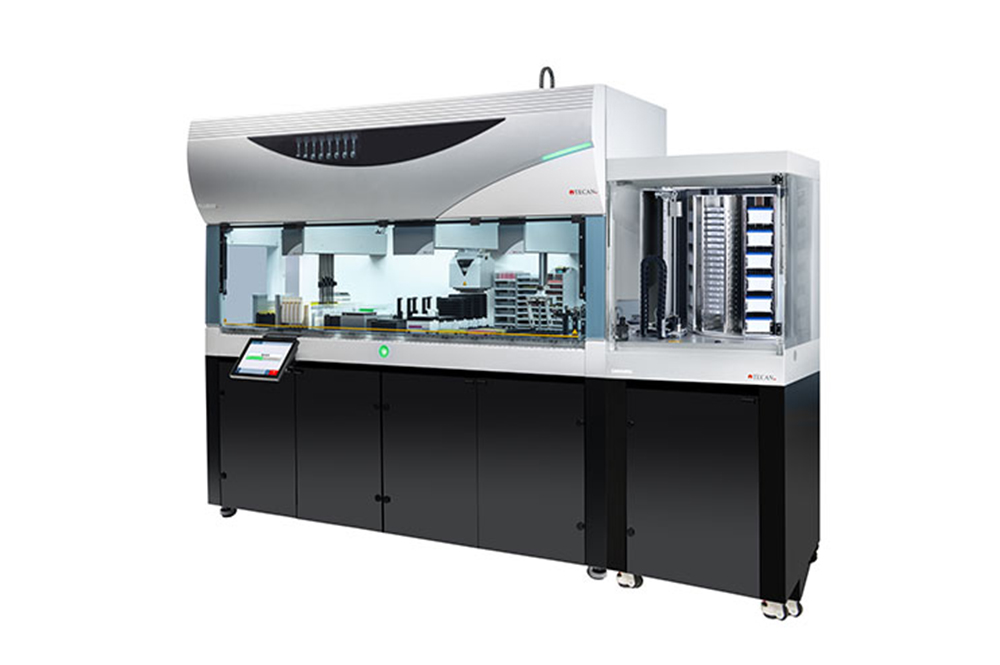
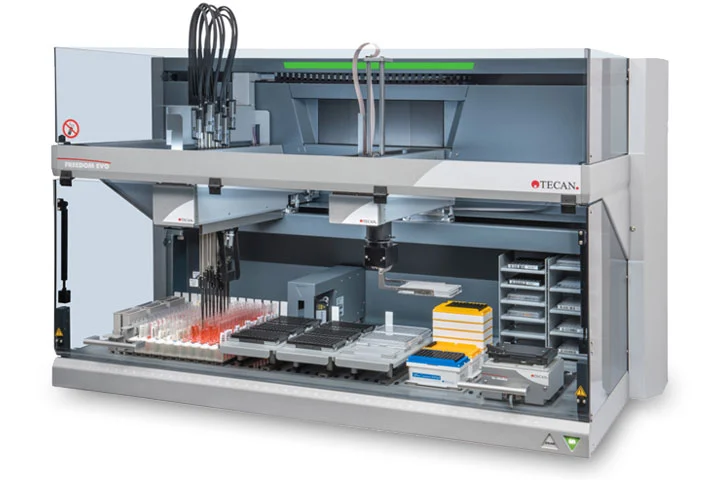
Best Devices for
Purification process development
We integrate with a variety of lab setups, but these are the ones we recommend for miniaturized purification experiments.
From our blog
View All Posts
A Synthesis interview
Meet Professor Chris Molloy, CEO at Medicines Discovery Catapult

6 min
A Synthesis interview
Meet Thierry Dorval, Head of Data Science and Management at Servier

7 min
A Synthesis interview
Meet Dan Thomas, CEO & Founding Consultant at Twenty24 Consulting
15 min